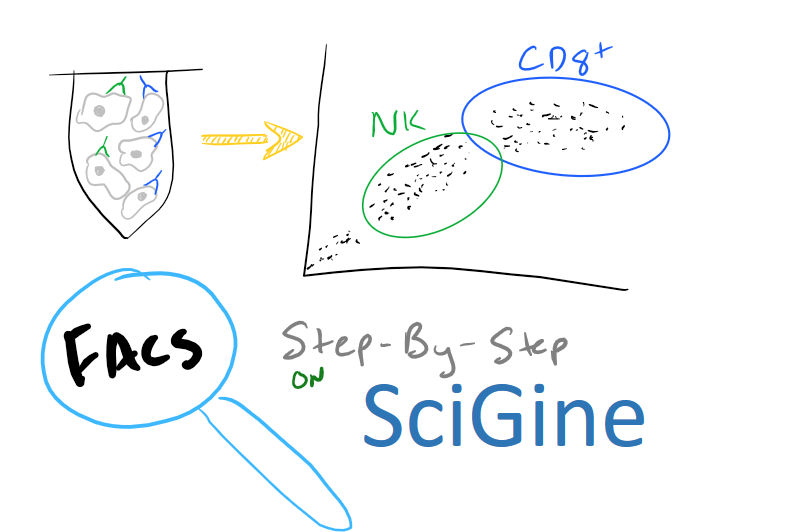
FACS Method Overview: Using Fluorescence to Understand Cells and Cell Populations.
FACS, or Fluorescence Assisted Cell Sorting, is a type of technique that enables you to understand cells by tagging them with fluorescent markers. There are a number of things that FACS allows you to do:
- Separate one type of cell from a mixture of cells
- Count how many cells are in a mixture
- Detect what kind of biomarkers a cell might have (is it cancerous? Just a regular lymphocyte? Etc.)
- Find out if your cell is making a protein of choice (similar to biomarker detection)
- And more.
It’s an amazing and powerful technique that you should always keep as part of your skills. Most Bio-Pharmaceutical companies have FACS experts in-house because it is so versatile!
Note: If you’re writing research papers, I highly recommend Grammarly – it’s a free grammar check plugin for Chrome. Try it out here…
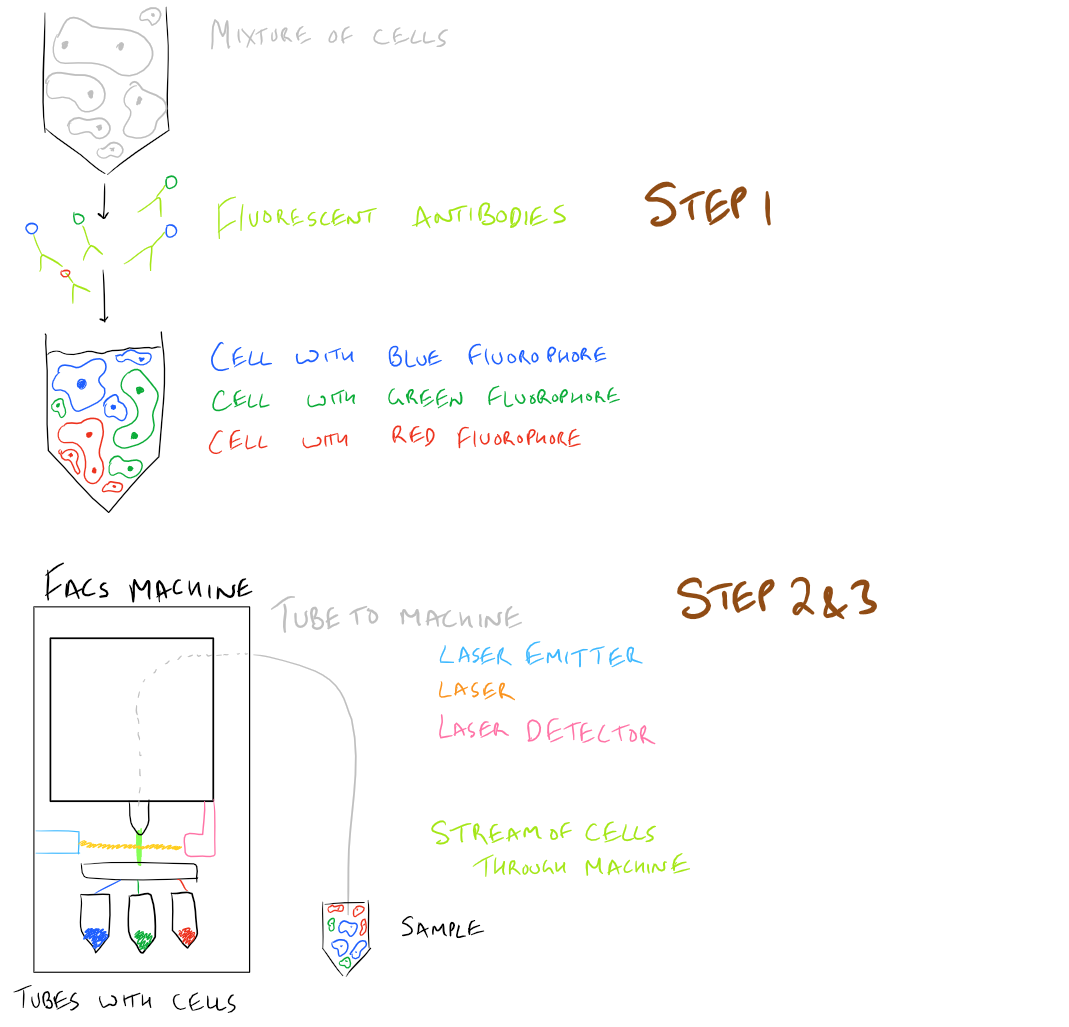
The principle of FACS is simple:
- Label cells of interest with a marker such as an antibody
- Pass the cells through a laser and detect which ones have the antibody
- Separate those cells from the rest
Here’s what this looks like in a simple picture:
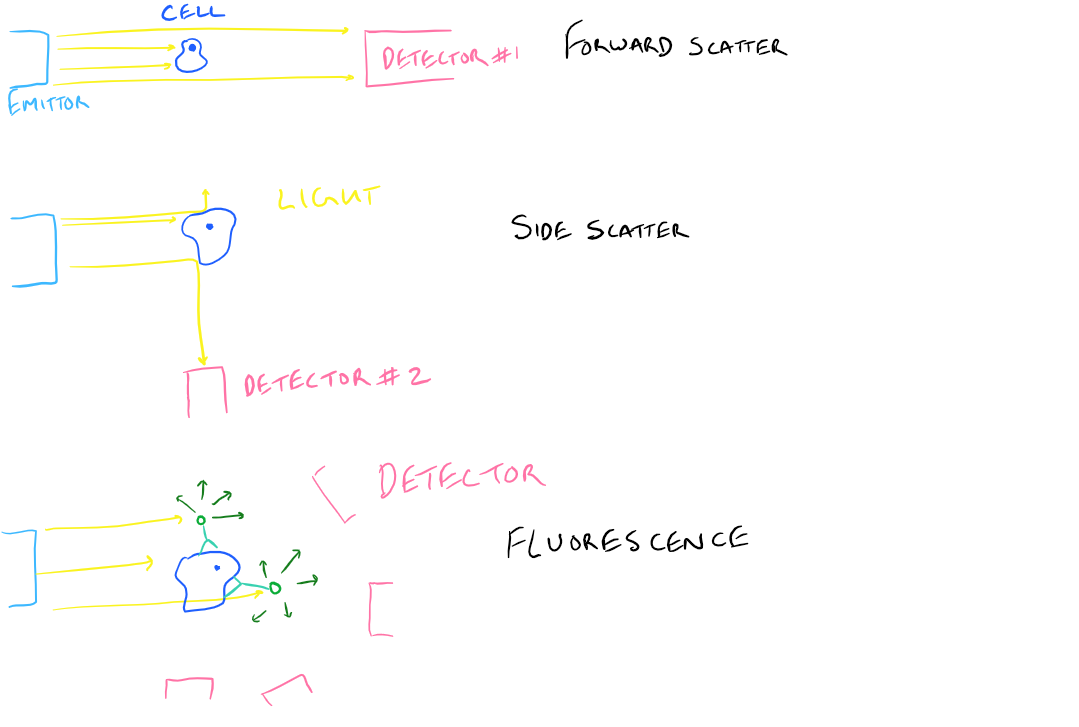
What does the FACS instrument detect?
- Forward Scatter Light (FSC): When you shine a laser on an object, the object blocks some of it and the rest continues to go forward towards the detector. This is called forward scattered light.
- Side Scatter Light (SSC): An object might also bounce some of the laser in an alternate direction. There is a detector that is orthogonal to the light direction and detects this scattered light.
- Fluorescence Emission Signal: Excite your fluorophores with a certain wavelength of light and they’ll emit a different wavelength depending on the type of fluorophore. Fluorescence detectors in the instrument will detect this emitted light.
Take a look at this illustration:
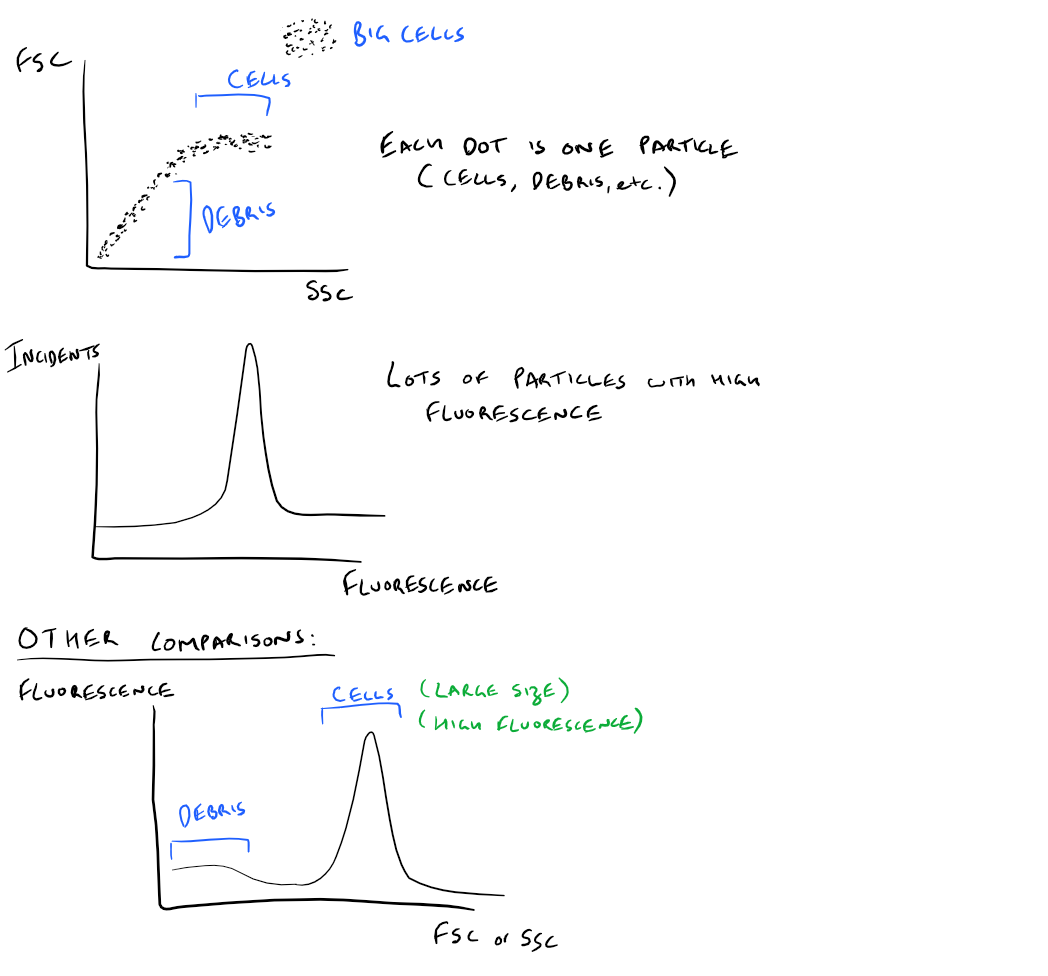
Based on the previous section, FACS provides data on forward scattered light, side scattered light, and fluorescence intensity. By graphing these different values together, you can get an idea of what your cell sample is like. Here’s the kind of data you would get:
- Plot of FSC vs. SSC:
- Cell debris in your solution is usually small, so it would have low FSC and SSC values.
- Normal cells have medium sized FSC and SSC values
- Large cells like Granulocytes have large FSC and SSC values
- Plot of Fluorescence intensity:
- After cleaning your cell solution and removing any non-specific fluroescence, your cells will be the only thing with large fluorescence intensity
- A plot of intensity provides you a histogram telling you how much fluorescence is in the solution
- You can use this to find out how many cells are there, how many antibodies bound to each cell, how much of a certain biomarker is there, etc.
- You can compare different fluorescence histograms to compare cell types as well
Take a look at these images:
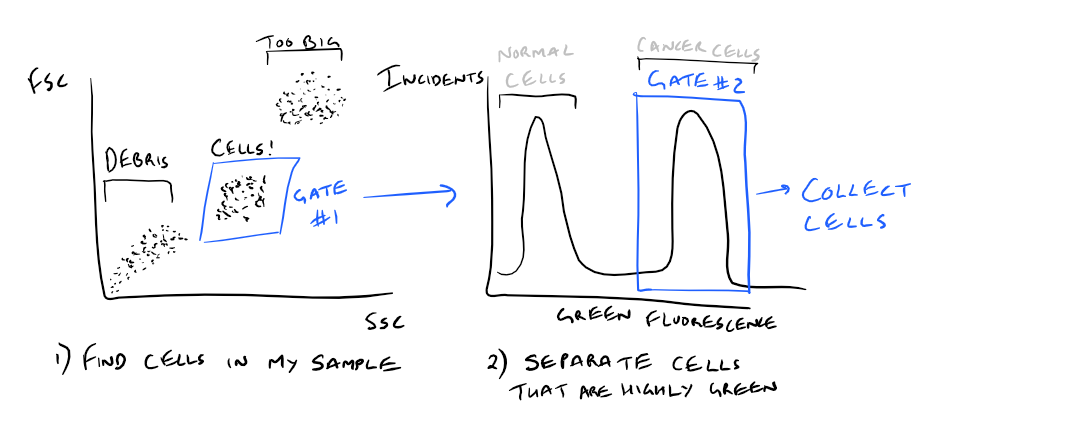
Gating: How to measure cells of only one population and ignore debris
In the above images you can see that your figures may provide information on several types of particles: debris, small cells, large cells, particles with high and low fluorescence, etc. In order to narrow down your results, most instruments allow you to “Gate” your results so that the instrument provides you with a new graph within limits that you set. As an example, you may plot FSC vs. SSC and then gate only for larger particles. Then using that gate you may look at the fluorescence intensity in Red, Green, and Blue. This way you can analyze cells that have red biomarkers, or cells that have blue biomarkers specifically.
As an example, what if you wanted to only collect cells that highly express one cancer-related cellular protein (ex: folate receptor) ?
Using FACS, this would be easy to analyze! Just mark your cells with an anti-folate receptor antibody with GFP. Then, use FACS to separate out the cells that express the receptor in your sample. Take a look at this image to understand this concept.
Note: Grammarly is a free grammar check plugin for Chrome. I used it for this article and really like it! Try it out here…
Complete Step by Step Method Guide
Unfortunately, this is such a highly instrument-oriented technique that it’s difficult for me to provide details on how to operate a FACS machine. Nonetheless, take a look here to get an idea.
Materials
Tissue Culture Flask
With cells such as HT-29
PBS
Trypsin such as Tryp LE from Invitrogen
Serological pipette
Hemacytometer
DMEM
Without pH indicator so that there isn’t any extraneous fluorescence
Method
- Grow HT-29 to confluence in a T-75 flask in 7 ml of DMEM
- Use lab protocols to mark them with any antibodies that you’d like such as an anti-folate receptor antibody
- Aspirate the DMEM and add PBS 1x
- Swirl around and remove PBS
- Wash once again with PBS by following the previous 2 steps
- Add 2 ml of Trypsin (TrypLE) and wait until cells detach for approx 10 minutes
- Collect cells into a falcon tube by using a serological pipette
- Use a hemacytometer to dilute cells until they are at a concentration of 1×10⁶ cells/ml using DMEM
- Load cells into the FACS using using appropriate 5 ml tubes
- Make sure the instrument is running well by using control samples or any extra cells that you have
- Replace cell collection tubes and make sure they are sterile if you plan on culturing cells that are collected
- Run the FACS instrument 🙂
Notes on this FACS/Flow Cytometry Methodology
- FACS may also be referred to as Flow Cytometry on Job Postings. This is because FACS is a part of the overall group of techniques called Flow Cytometry. In biology, however, it is unlikely that you will use any other techniques besides this one.
- The types of tubes that are necessary for loading a FACS unit vary between instruments
- Some cells clump up and make data analysis harder. Try diluting them more or mixing them more using your serological pipette
- It’s important to set the instrument’s gain settings to maximize/minimize signals as appropriate
- Make sure to also set the correct excitation/emission levels for your various fluorescence markers. You will also need to set your thresholds such that your signals don’t overlap.
- If you plan on using multiple fluorescence markers at the same time make sure you consult a fluorescence ex/em table like this fluorescence spectra table. You need to make sure that your fluorescent signals don’t overlap.
Applications of FACS on SciGine
Analysis of cell cycle and viability with a FACScan
Analysis of a GFP reporter gene using FACS
Analysis of gene disruption in diploids
Using FACS to analyze camptothecin induced apoptosis
FACS analysis of cell cycle using Propidium Iodide
References
Excellent Antibodies-Online FACS reference
Thermofisher FACS manual
What is FACS from UMass